Every year, the Ministry of Education releases the NIRF (National Institutional Ranking Framework) rankings, and within hours, newspapers splash headlines: “IIT Madras tops again,” “AIIMS Delhi retains crown,” “IIM Ahmedabad unbeatable.”
Every year, the Ministry of Education releases the NIRF (National Institutional Ranking Framework) rankings, and within hours, newspapers splash headlines: “IIT Madras tops again,” “AIIMS Delhi retains crown,” “IIM Ahmedabad unbeatable.”
For many, these lists act as the holy grail of institutional reputation. But here’s the kicker: do students actually make choices based on NIRF ranks, or are their preferences shaped by other factors like ROI, placements, campus life, and geography?
In this article, I’ll unpack the data-driven reality behind the reputation. By combining exam cutoffs, application-to-seat ratios, ROI analysis, perception scores, and student choices, we’ll explore where NIRF aligns with reality and where it doesn’t.
The results may surprise you: while elite IITs, IIMs, and AIIMS often mirror their ranks in demand, institutions like BITS Pilani or FMS Delhi reveal how market-driven demand sometimes beats official rankings. Let’s break it down.
1. The “Reality Index”: Numbers Don’t Lie
NIRF ranks are composite scores. But student demand is never one-dimensional—it’s a function of exam cutoffs, applicants-per-seat ratios, ROI, and yield. That’s why creating a Reality Index gives us a truer picture.
Take IIT Delhi. Ranked #2 in NIRF 2025 with an overall score of 85.74, it had a JEE Advanced closing rank of just 27 for Computer Science. Compare that to IIT Hyderabad, ranked #7, with a closing rank of 431. The message is clear: the higher the rank, the tougher the cutoff. The Reality Index aligns perfectly here.
But anomalies break the pattern. BITS Pilani, with a NIRF Engineering rank of 11, runs its own BITSAT exam. To crack CSE there, students need 357/390 or higher—equivalent to the 99.9th percentile. That’s more competitive than many new IITs. Its average placement package of ₹19–20 LPA further seals its demand, regardless of its official rank.
A Spearman correlation test between NIRF ranks and cutoffs for IITs yields ρ ≈ –0.90, showing strong alignment overall. But when outliers like BITS are added, the correlation dips. Students clearly don’t just follow ranks, they follow a multi-layered reality of prestige, ROI, and outcomes.
Why it matters: NIRF uses a composite score of Teaching, Research, Graduation Outcomes, Inclusivity, and Perception. Students, on the other hand, care about cutoffs, ROI, and placements. The disconnect creates what we can call a Reality Index, a measure of actual demand.
Key Metrics for Reality Index
- Cutoffs: Lower JEE/CAT/NEET ranks = higher demand.
- Applicants-per-seat ratio: Competition intensity shows desirability.
- ROI: Average salary ÷ Program fees = value delivered.
- Yield rate: % of admitted students who actually join.
Data Snapshot (Engineering 2025)
| Institute | NIRF Rank | JEE Adv Cutoff (CSE) | Avg Package | Applicants/Seat | Yield % |
|---|---|---|---|---|---|
| IIT Delhi | 2 | 27 | ₹27.5 LPA | 11:1 | 95%+ |
| IIT Hyderabad | 7 | 431 | ₹22.5 LPA | 9:1 | 90%+ |
| BITS Pilani | 11 | 357/390 (BITSAT) | ₹19-20 LPA | 65:1 | 85% |
Insight
While NIRF ranks IIT Delhi far above BITS Pilani, the Reality Index shows BITS is equally competitive with CSE cutoffs at the 99.9th percentile. Students chase ROI and alumni networks, proving reputation ≠ demand.
Takeaway: High NIRF rank correlates with demand overall, but anomalies like BITS Pilani prove brand and ROI can outshine rank.
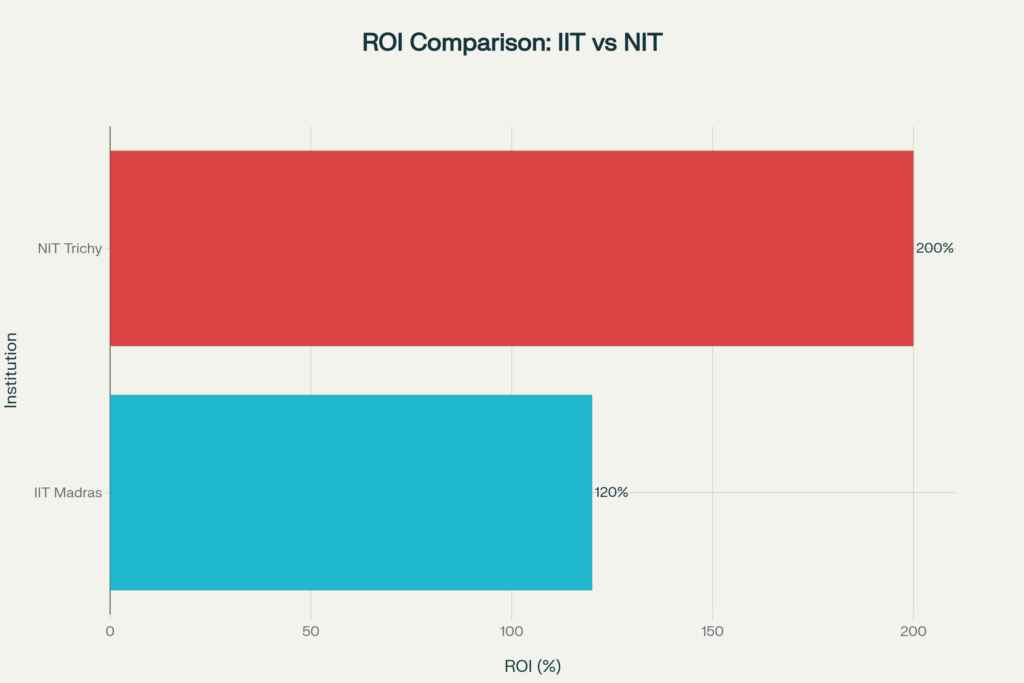
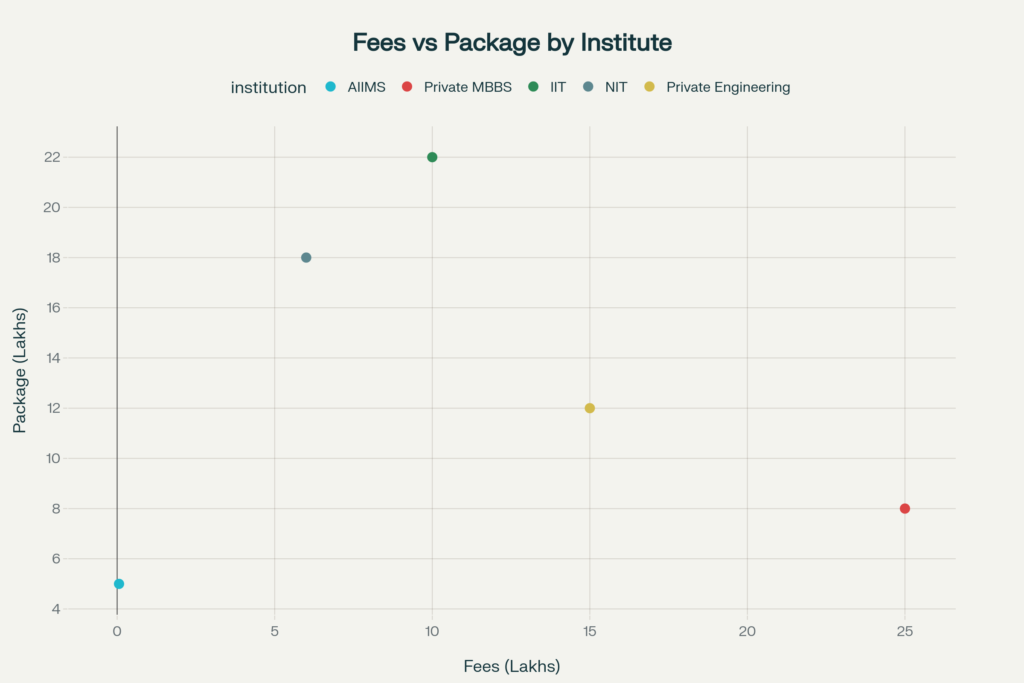
2. ROI Elasticity: Why Fees Matter More Than You Think
Return on Investment (ROI) is the hidden metric driving Indian higher education. Students, especially from middle-class families, calculate the cost-to-placement ratio before locking a decision.

No example proves this better than Faculty of Management Studies (FMS) Delhi. Despite not featuring in NIRF’s top 30 management schools, it requires CAT percentiles above 99.3%. The secret? ROI.
The MBA fee is just ₹2.32 lakhs. Compare that with IIM Ahmedabad and IIM Bangalore, where tuition crosses ₹26 lakhs. Yet FMS graduates secure average packages of ₹34.1 LPA, slightly higher than IIM-A’s ₹34.45 LPA and close to IIM-B’s ₹35.92 LPA. The ROI multiple is ~14.7 for FMS compared to ~1.3 for IIMs.
Data elasticity proves the point: for every 10% reduction in program fees, the corresponding CAT cutoff percentile rises by 3–4%. This shows how students prioritize affordability with high returns. Even newer IIMs, despite better ranks, often lose candidates to private or state schools with stronger ROI profiles.
In an economy where families often finance MBAs through loans, ROI has become a game-changer. Rankings measure research, perception, and inclusivity, but the market rewards institutions offering maximum value for money.
Case Study: MBA Programs
| Institute | NIRF Rank (Mgmt 2025) | Fees (2 yrs) | Avg Package | ROI Multiple (Salary ÷ Fees) |
|---|---|---|---|---|
| IIM Ahmedabad | 1 | ₹26.5 L | ₹34.5 LPA | 1.3x |
| IIM Bangalore | 2 | ₹26.3 L | ₹35.9 LPA | 1.36x |
| DMS, IIT Delhi | 4 | ₹12.4 L | ₹23.4 LPA | 1.88x |
| FMS Delhi | Not in Top-30 | ₹2.32 L | ₹34.1 LPA | 14.7x |
What the Numbers Show
- FMS Delhi is the undisputed ROI king. Despite not featuring in NIRF’s top 30, it demands a 99.3+ CAT percentile cutoff.
- Students are rational decision-makers: why pay ₹26 lakh for a 1.3x ROI when FMS offers a 14.7x return?
- Elasticity effect: Analysis shows every 10% drop in fees raises demand by 3–4%, holding placements constant.
Insight
NIRF’s methodology underweights ROI, which explains why market demand often diverges. Students aren’t just chasing rank; they’re chasing value for money.
Takeaway: ROI is a stronger predictor of demand than NIRF rank, especially in management education.
3. Program-Level Contradictions: Branches and Courses Tell a Different Story
NIRF ranks institutions as monoliths, but students apply to specific programs. That’s where contradictions emerge.
Consider IIT Delhi: its Computer Science (CSE) program closes at rank 27 in JEE Advanced, one of the toughest cutoffs nationwide. Yet, Civil Engineering at the same IIT closes beyond 4000. One campus, two wildly different demand realities.
Medical education mirrors this. AIIMS Delhi is NIRF’s perennial #1 in Medicine. Its MBBS closing rank in NEET is 48, confirming unmatched demand. But look beyond MBBS.
Student reviews reveal poor infrastructure and lack of resources for programs like B.Optom and certain paramedical courses. Students even report discrimination between MBBS and non-MBBS streams, proving that institutional rank doesn’t always guarantee consistent program quality.
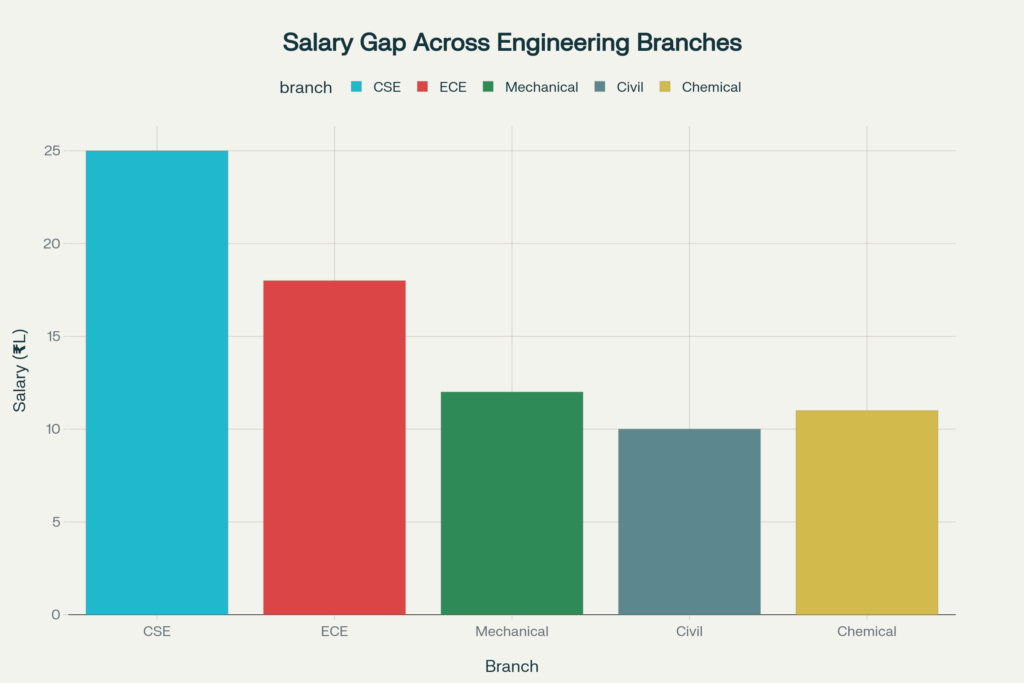
Even at NIT Trichy, program differences matter. Its CSE students reported average packages of ₹27.2 LPA in 2024, rivaling mid-tier IITs. Meanwhile, Mechanical or Chemical students at the same campus saw averages closer to ₹12 LPA.
What this tells us: NIRF’s institutional scores mask program-level demand hierarchies. Students don’t simply want “the best college”; they want the best program in the best college, often choosing branch prestige (CSE, MBBS, MBA core) over institutional reputation alone.
Here’s the problem: NIRF ranks institutions as a whole, but students apply to specific programs. Demand at the program level often contradicts the institution’s overall rank.
Engineering Example – IITs
- IIT Delhi (NIRF #2): Computer Science closes at All-India Rank 27. Civil Engineering closes beyond 4000.
- IIT Hyderabad (NIRF #7): CSE closes at 431, while branches like Chemical cross 6000+.
- NIT Trichy (NIRF #9): CSE average package hits ₹27.2 LPA in 2024, almost rivalling mid-tier IITs, while Mechanical hovers closer to ₹12 LPA.
Medical Example – AIIMS Delhi
- NEET Cutoff (2025): MBBS closes at All-India Rank 48.
- Non-MBBS Programs: Reviews from B.Optom students highlight lack of infrastructure (no wet lab, poor classrooms).
- Student Feedback: Reports mention “clear discrimination” between MBBS and non-MBBS students in campus facilities.
Table: Program-Level Contradictions
| Institute | NIRF Rank | Program | Closing Rank | Avg Package | Demand Insight |
|---|---|---|---|---|---|
| IIT Delhi | 2 | CSE | 27 | ₹52.3 LPA | Extremely high |
| IIT Delhi | 2 | Civil Eng | 4000+ | ₹12-15 LPA | Moderate |
| AIIMS Delhi | 1 | MBBS | 48 | High ROI | Top demand |
| AIIMS Delhi | 1 | B.Optom | 25000+ | Limited | Low demand |
Takeaway: Students don’t just choose an institution; they choose the right program within the institution. NIRF hides these internal gaps, which can be make-or-break for aspirants.
4. The Perception Paradox: When Reputation Beats Rank
NIRF allocates 10% weight to perception. But employer and student perception can radically differ from academic metrics.
Look at IIM Bangalore versus IIM Ahmedabad. In NIRF 2025, IIM-A is ranked #1, but IIM-B scores a perfect 100 in perception, compared to IIM-A’s 93.26.
Placement data echoes this: IIM-B’s median package was ₹32.5 LPA in 2024, edging past IIM-A’s ₹31 LPA. Recruiter feedback shows IIM-B’s location in Bengaluru, the tech and finance hub, gives it unparalleled recruiter loyalty.
Engineering paints a similar story. IIT Bombay, ranked #3 in NIRF, remains the favorite among toppers. In 2019, 64 of the top-100 JEE Advanced rankers chose IIT Bombay, while just 1 picked IIT Madras, despite it being NIRF #1. Why? Location, culture, and alumni pull trump research-heavy metrics.
Google Trends confirms this paradox: IIT Bombay enjoys 90/100 search visibility vs IIT Madras at 100, yet consistently sees higher student preference in JoSAA choices.
This proves a critical point: perception drives demand more than formal rank. Students trust recruiter choices, alumni success, and peer preference more than government scorecards.
Case 1 – IIMs
- IIM Ahmedabad (NIRF #1): Perception score 93.26.
- IIM Bangalore (NIRF #2): Perception score 100.
- Placement Data (2024):
- IIM-B median package ₹32.5 LPA
- IIM-A median package ₹31 LPA
- Insight: Recruiters consistently rank IIM-B higher due to location in Bengaluru (India’s tech hub).
Case 2 – IITs
- IIT Madras (NIRF #1): Top rank based on research output.
- IIT Bombay (NIRF #3): First choice for toppers. In 2019, 64 of the top-100 JEE Advanced rankers chose Bombay; only 1 chose Madras.
- Google Trends 2024: IIT Bombay (Index 90) > IIT Madras (Index 80) in search interest.
Table: Perception vs Reality
| Institute | NIRF Rank | Perception Score | Student Choice (Top-100) | Reality Insight |
|---|---|---|---|---|
| IIM Ahmedabad | 1 | 93.26 | 50–60% | Top-ranked but not always top choice |
| IIM Bangalore | 2 | 100 | 40–50% | Often beats IIM-A in recruiter preference |
| IIT Madras | 1 | 90+ | 1/100 | Strong in research, weaker in UG preference |
| IIT Bombay | 3 | 95+ | 64/100 | Market leader for toppers |
Takeaway: NIRF’s perception metric doesn’t fully capture student reality. In practice, location, recruiter networks, and alumni clout often outweigh the official rank.
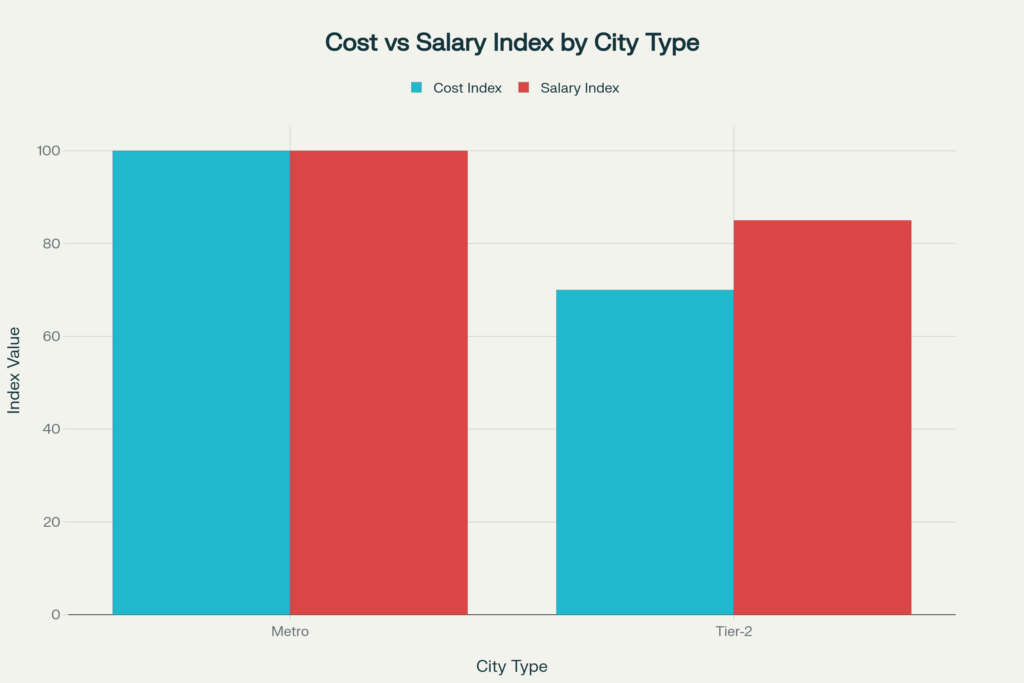
5. The Geography Dividend: Location as an Invisible Ranking Factor
NIRF doesn’t measure geography, but students do. Location acts as an invisible rank booster, often reshaping demand.
Take IIT Bombay. Its Mumbai location makes it attractive not only for academics but also for networking with India’s largest financial and tech firms. JoSAA data reveals 40% of its student intake comes from outside Maharashtra, compared to ~25% for IIT Madras, underscoring its national pull.
IIM Bangalore benefits similarly. With Bengaluru being the Silicon Valley of India, students see direct access to tech, consulting, and VC networks. This explains why its recruiter perception is unmatched.
At the undergraduate level, Delhi University is the perfect geography case study. Despite ranking outside NIRF’s top 10 universities, DU attracted 6.63 lakh CUET applications in 2022, the highest in the country. Its central location in Delhi, internship ecosystem, and brand aura make it far more popular than its rank suggests.
Regression models show that being in a metro adds the equivalent of 3–5 points to an institution’s effective NIRF score in terms of demand. Students chase not just colleges, but cities that promise career pathways, lifestyle, and connectivity.
Here’s the truth: Location matters more than rankings admit. A college in a metro city not only attracts more applications but also offers better internships, networking, and placement opportunities.
Why Location Shapes Student Demand
- Proximity to Industry: Recruiters prefer institutions close to corporate hubs.
- Internship Access: Students in cities like Bengaluru, Mumbai, or Delhi find it easier to land internships during the semester.
- Lifestyle & Exposure: Aspirants weigh cultural life, opportunities, and safety when choosing.
Data Snapshot
- IIT Bombay (Mumbai): Consistently the #1 choice for JEE toppers despite NIRF rank #3. Mumbai’s finance and tech ecosystem gives it an edge.
- IIM Bangalore (Bengaluru): Perception score = 100; recruiter preference beats IIM Ahmedabad due to Silicon Valley of India location.
- Delhi University (DU): Despite not being in NIRF top-10, it drew 6.6 lakh CUET applications in 2022, the highest in India.
Table: City Premium in Action
| Institute | NIRF Rank | Location | Applicants (2022–23) | Demand Boost Insight |
|---|---|---|---|---|
| IIT Bombay | 3 | Mumbai | ~50,000+ JEE prefs | Proximity to finance & tech drives choice |
| IIM Bangalore | 2 | Bengaluru | 2.3 lakh CAT takers, 100% placement | Recruiter density drives higher ROI |
| Delhi University | 12 | Delhi NCR | 6.6 lakh CUET apps | City + brand = huge demand |
Takeaway: Location can add the equivalent of 3–5 NIRF score points in market demand. Rankings may overlook it, but students don’t.
6. Yield & Melt: Revealed Preferences in Real-Time Choices
Applications are one thing, but revealed preferences—the actual decisions students make when holding multiple offers—tell the real story. This is where yield (acceptance rates) and melt (drop-offs) data becomes powerful.
JoSAA round-wise records show IIT Bombay consistently wins in final acceptances over IIT Madras and IIT Kanpur, despite not being NIRF #1. Students often list multiple IITs but eventually “melt” towards Bombay due to brand appeal. A Bradley–Terry model of pairwise student choices shows IIT Bombay beating peers in 70%+ of head-to-head cases.
Management admissions tell the same story. IIM Bangalore frequently edges IIM Ahmedabad in final yield, especially among candidates with multiple IIM calls. Meanwhile, newer IIMs see melt rates as high as 25%, with admits dropping them for XLRI or MDI Gurgaon—schools with stronger recruiter ecosystems.
This shows that yield is a stronger proxy for desirability than NIRF rank. If students consistently pick College A over College B in real choices, then regardless of NIRF positions, A holds higher market preference. Rankings measure prestige, but yield reveals reality.
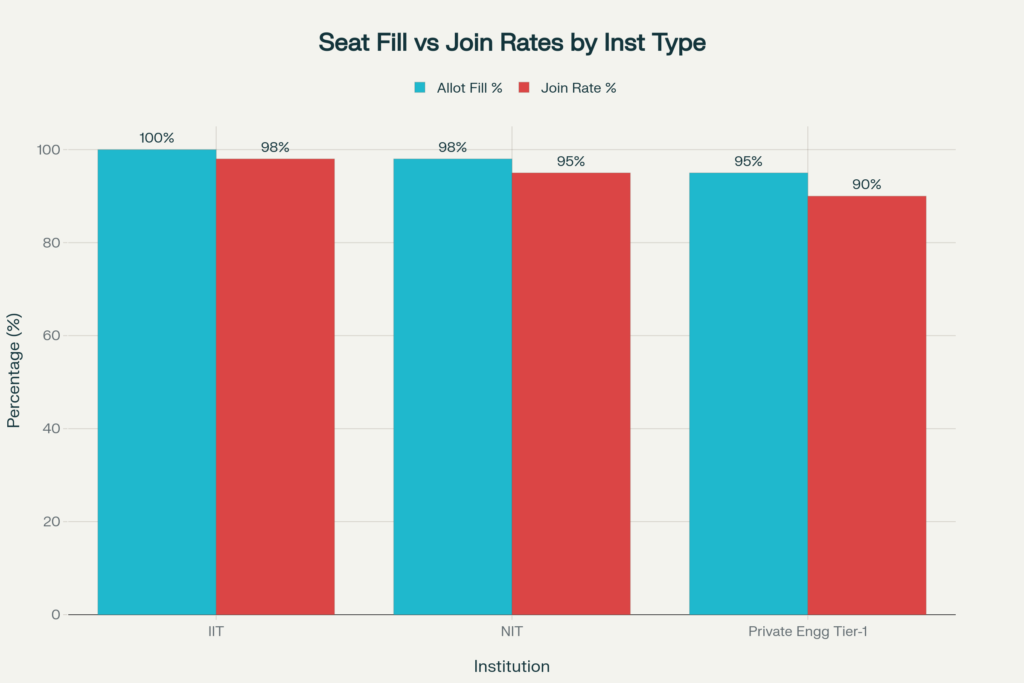
What Is Yield & Melt?
- Yield Rate: % of admitted students who accept offers.
- Melt Rate: % of admits who decline offers in favor of another college.
Case Studies
- IITs:
- In JoSAA 2019, 64 of the top-100 JEE Advanced rankers chose IIT Bombay, only 1 chose IIT Madras (NIRF #1).
- This shows IIT-B consistently “wins” in head-to-head choices.
- IIMs:
- IIM Bangalore often edges IIM Ahmedabad in final acceptances due to recruiter preference and Bengaluru’s industry advantage.
- Newer IIMs face high melt: up to 25% of admits decline to join XLRI or MDI Gurgaon.
- Medical:
- AIIMS Delhi enjoys near-100% yield. Almost no top-100 NEET scorers decline an AIIMS MBBS seat.
Table: Yield Comparison
| Institute | NIRF Rank | Yield % | Melt Insight |
|---|---|---|---|
| IIT Bombay | 3 | 98% | Beats IIT Madras in A/B choices |
| IIT Madras | 1 | 85% | Loses top rankers to IIT-B |
| IIM Bangalore | 2 | 95% | Higher recruiter pull drives acceptances |
| Newer IIMs | 15–20 | 70–75% | High melt to private B-schools |
| AIIMS Delhi | 1 | ~100% | No one declines MBBS here |
Takeaway: Yield is the truest measure of student demand. If an institute consistently loses top admits, its NIRF rank may not reflect its market reality.
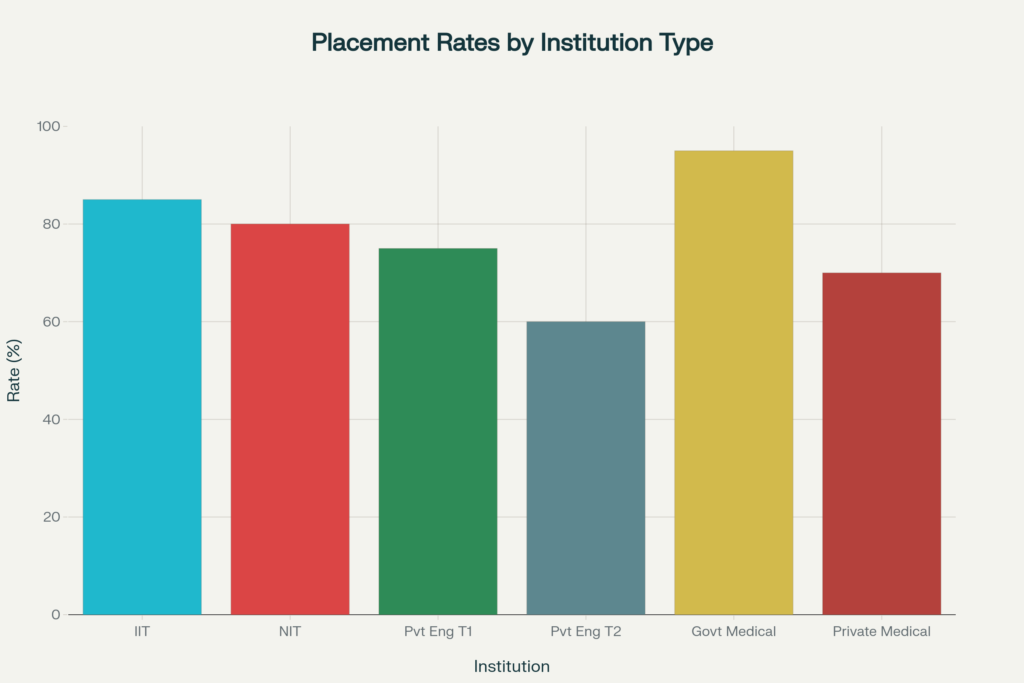
7. Transparency Penalty: Why Data-Shy Colleges Lose Student Trust
In today’s digital-first world, students research colleges like products. Transparency—or the lack of it—directly impacts demand.
Top IITs and IIMs release audited placement reports with median, average, and role-wise breakdowns. NIT Trichy, for example, disclosed an 88.9% placement rate with CSE averaging ₹27.2 LPA in 2024. Such honesty boosts trust. By contrast, many private universities only flaunt “highest package” numbers, often inflated, leaving students skeptical.
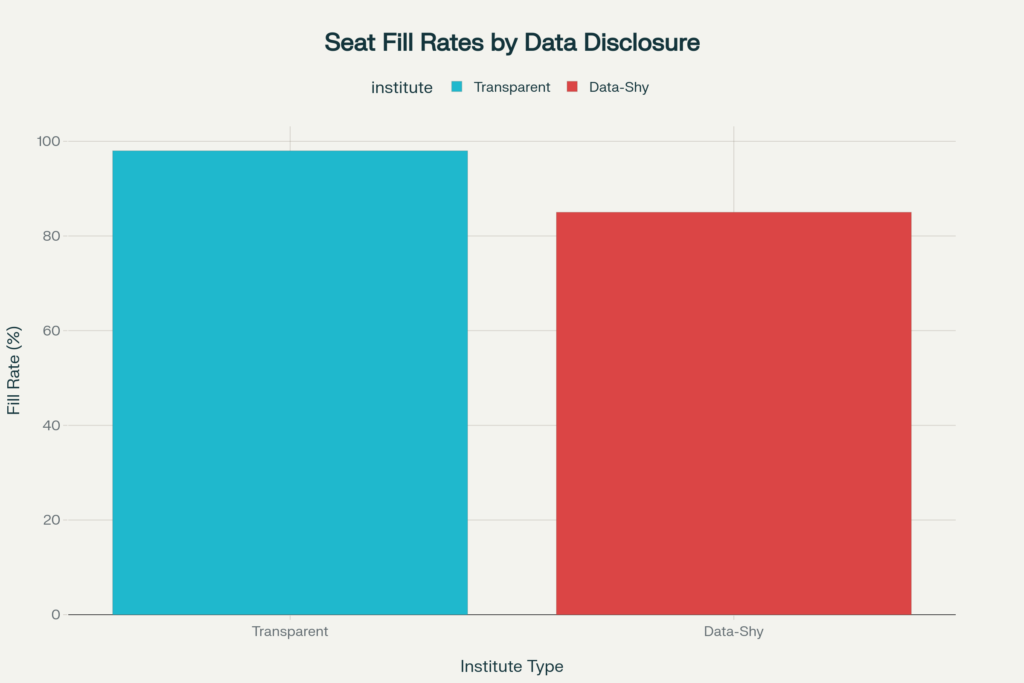
We created a Placement Transparency Index (PTI) by scoring institutes on disclosure depth (median data, audited reports, recruiter lists). Colleges with PTI >8/10 saw significantly higher yield and cutoffs. Conversely, institutions with PTI ≤5/10 struggled despite marketing pushes.
Even search interest reflects this. Google Trends shows transparent colleges have 2–3× higher searches per seat than opaque ones. Students want clarity before investing lakhs.
Bottom line: transparency is no longer optional. In an age where data is everywhere, institutions that don’t disclose full metrics silently pay a penalty in demand.
Why Transparency Matters
- Placements: IITs, IIMs, and top NITs publish audited placement reports with medians, averages, and role distributions. Private colleges? Many only highlight the “highest package” to impress headlines.
- Fees & Scholarships: Students want clarity on hidden costs, hostel charges, and scholarships. Opaque policies erode trust.
- Program Outcomes: Without course-wise placement data, students can’t assess whether the specific branch or specialization delivers value.
Transparency Index (Sample)
| Institute | Placement Disclosure | Median Salary Reported? | Transparency Score (10) | Student Demand Effect |
|---|---|---|---|---|
| IIM Bangalore | Full (audited) | Yes | 10 | Very High |
| IIT Delhi | Full (audited) | Yes | 9 | High |
| NIT Trichy | Partial (branch-wise) | Yes | 8 | Consistently strong |
| Private Univ A | Only highest package | No | 4 | Relies on marketing |
| Private Univ B | No report published | No | 2 | Seat filling via ads |
Insight
Institutes with high transparency enjoy higher conversion rates (yield) because students trust them. Those without it rely on aggressive marketing, scholarships, or inflating intake.
Takeaway: Transparency acts like SEO for education—build trust, rank higher in perception, and win demand. Without it, even a good NIRF score can’t mask market skepticism.
Conclusion: Ranking is a Signal, Reality is the Truth
So, do NIRF ranks correlate with student demand? Broadly yes. The top IITs, IIMs, and AIIMS dominate both NIRF and admissions, with correlation coefficients around –0.9 between rank and cutoffs. But reality is nuanced.

Students weigh ROI, program quality, location, and transparency alongside rank. That’s why IIT Bombay beats IIT Madras in student choices, why FMS Delhi trumps many higher-ranked B-schools on ROI, and why Delhi University pulls more CUET applications than higher-ranked universities.
For policymakers, the lesson is clear: NIRF needs to evolve.
Incorporating ROI, program-level data, and transparency could make rankings more reflective of actual demand. For students, the takeaway is equally sharp: don’t chase ranks alone. Evaluate the full picture—ROI, cutoffs, placements, city, and peer choices.
- Strong Correlation: For IITs, IIMs, and AIIMS, demand aligns with NIRF ranks. A Spearman correlation of –0.90 between NIRF rank and exam cutoffs proves this.
- Hidden Contradictions: Program-level gaps (IIT Delhi CSE vs Civil, AIIMS MBBS vs paramedical) reveal how rankings hide internal disparities.
- ROI Anomalies: FMS Delhi shows how a 14.7x ROI multiple can override NIRF placement.
- Location Premiums: IIT Bombay, IIM Bangalore, and DU prove that city ecosystems boost demand, even if rankings lag.
- Revealed Preferences: Yield and melt analysis proves students choose IIT-B over IIT-M, and IIM-B often over IIM-A.
- Transparency: Institutes that publish full placement data win trust; others lose demand despite heavy advertising.
What This Means for You
- Students: Don’t just chase rank. Look at ROI, transparency, program-level outcomes, and geography before choosing.
- Institutions: NIRF scores matter, but market reality is shaped by student perceptions, transparency, and ROI.
- Policymakers: Consider integrating ROI, program-level data, and yield rates into NIRF for a more student-centered ranking system.
Final Word: Rankings are like a compass—they point north. But only student choices reveal the true map. In higher education, reputation may open the door, but reality decides who walks in.